Troubleshooting Network issues using MTR
Introduction
MTR originally stood for Matt’s Traceroute though is now more commonly known as “My traceroute” it is an invaluable tool for diagnosing network issues such as speed issues, high latency or packet loss. MTR can be ran on Windows, MacOS or Linux.
What is MTR
By now you are probably familiar with basic network diagnostic tools such as ping and traceroute, MTR effectively combines these tools into one using ICMP packets to measure the availability of routers and the time take to travel between hops. As MTR runs continuously it offers significant advantages over a traceroute because the output is updated continuously.
MTR on Windows
We recommend WinMTR for use on machines running Windows Operating Systems however as an alternative, Windows also has a program built in called pathping which works in a similar way and more details can be found on Microsoft’s website here.
Installing MTR on Windows
MTR runs on windows in a standalone application and is very simple to download and install on Windows. The latest release winmtr-0-92 can be downloaded here from the Fraction Servers website for both 32Bit and 64Bit operating systems, once downloaded simply extract the zip file and open the application. Please note as Windows uses “WinMTR” this provides a limited feature set and the full choice of options when running the test is only available within Linux or MacOS X.
Running an MTR
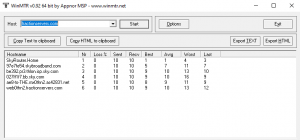
Once installed the software will look like this, simply enter a website or IP address into the host box and click start to initiate your MTR.

MTR Options in Windows
There is a limited number of options available within WinMTR indicated below:

- Ping size. This is best left as default (64 bytes) for standard network troubleshooting however you can increase the bite size if required. This is useful if you need to have Jumbo Frames enabled on your network and wish to test the MTU across a network.
- Resolve names – Reverse DNS entries can be changed by an IP provider and make it difficult to see on which network your packet loss is appearing, sometimes therefore it is wise to just untick the box and manually lookup IPs using a WHOIS to find the network operator rather than resolving DNS.
- Interval (sec) – This is the interval at which the ICMP traffic will be sent to the routers along the path to your host. This is normally best left at a default of 1 second however can be highered (possibly for reducing the impact of ICMP rate limiting explained below) or lowered for a more sensetive test.
MTR on Linux
Installing MTR on Linux
To install MTR on Debian and Ubuntu operating systems you can run:
apt install mtr-tiny
To install MTR on RHEL, CentOS and Fedora operating systems you can run:
yum install mtr
Running an MTR
An mtr can be invoked from a linux terminal simply by typing mtr followed by the URL or IP you want to run the test to for example:
mtr fractionservers.com
MTR Options in Linux
- IPv4 Only – You can add the “-4″ flag onto the end of your MTR command to force MTR to use IPv4 and not lookup RDNS records.
- IP and Hostnames – You can add the “-b” flag to display IPs and Hostnames
- Save Results to a File – Adding the > “filename” at the end of your MTR command will save the results to a file with that name
- Change Interval – The default interval is 1 second, you can change this to a higher or lower value by using the -i flag.
- Force TCP or UDP – This can be achieved with –udp or –tcp
- Set Packet Size – Using the -s flag you can specify the packet size (default 64 bytes)
What do MTRs show?
Whilst MTR results are fairly self explanatory there are a number of important points that you should note when analysing the results which are detailed below:
Reading MTR Results
MTR results are sorted into rows and colums. The rows are simply the different routers or hops on the route your packets take to their destination. The colums can be defined as follows:
- % – Packet Loss
- Sent – Number of Packets Sent
- Recieved – Number of Packets Recieved (The difference between Sent and Recieved is used to calculate the % packet loss)
- Best/Avg/Wrst/Last – These four colums are all measurements of latency in milliseconds (e.g. ms). Last is the latency of the last packet sent, Avrg is average latency of all packets, while Best and Wrst display the best (shortest) and worst (longest) round trip time for a packet to this host. In most cases, the average (Avrg) column should be the focus of your attention.
A typical MTR would look as follows:
Host Loss% Snt Last Avg Best Wrst StDev
1. server.fractionservers.com 0.0% 359 7.6 8.2 0.2 71.4 11.2
2. cov-kcom.mx0the.as42831.net 0.0% 358 3.4 3.6 3.3 19.6 1.3
3. linx-router.london.com 0.0% 358 4.8 6.4 4.7 171.6 9.4
4. 108.170.246.161 0.0% 358 5.5 5.7 5.3 47.5 2.2
5. 216.239.57.121 0.0% 358 3.3 3.3 3.3 3.5 0.0
6. dns.google 0.0% 358 3.3 3.3 3.2 3.6 0.
Packet Loss %
We will start by looking at arguablly the most important first column from an MTR, packet loss. This shows the % packet loss at each hop, you should first look at the % packet loss to the destination if there is no packet loss to the destination then there cannot be packet loss at any of the hops along the route to the destination. This is extremely important to remember, many routers employ a technique often referred to as “Control Plane Limiting” or “ICMP Rate Limiting” this causes the router to drop packets/traffic that are directly targetted at the router’s IP address, therefore an MTR that looked as follows with no packet loss to the destination would not indicate an issue.
For example the MTR below shows packet loss at hop 3 however as there is no packet loss at the destination IP this would not indicate an issue here, the router at hop 3 is simply limiting ICMP packets to it’s management interface but still passing ICMP traffic as normal.
Host Loss% Snt Last Avg Best Wrst StDev
1. server.fractionservers.com 0.0% 359 7.6 8.2 0.2 71.4 11.2
2. cov-kcom.mx0the.as42831.net 0.0% 358 3.4 3.6 3.3 19.6 1.3
3. linx-router.london.com 7.2% 358 4.8 6.4 4.7 171.6 9.4
4. 108.170.246.161 0.0% 358 5.5 5.7 5.3 47.5 2.2
5. 216.239.57.121 0.0% 358 3.3 3.3 3.3 3.5 0.0
6. dns.google 0.0% 358 3.3 3.3 3.2 3.6 0.0
This can be compared with the MTR below where packet loss starts at hop 3 and continues to the destination which indicates an issue starting at the router at hop 3.
Host Loss% Snt Last Avg Best Wrst StDev
1. server.fractionservers.com 0.0% 359 7.6 8.2 0.2 71.4 11.2
2. cov-kcom.mx0the.as42831.net 0.0% 358 3.4 3.6 3.3 19.6 1.3
3. linx-router.london.com 7.2% 358 4.8 6.4 4.7 171.6 9.4
4. 108.170.246.161 7.3% 358 5.5 5.7 5.3 47.5 2.2
5. 216.239.57.121 7.2% 358 3.3 3.3 3.3 3.5 0.0
6. dns.google 7.3% 358 3.3 3.3 3.2 3.6 0.0
Some loss can also be explained by problems in the return route. Packets will reach their destination without error, but have a hard time making the return trip. This will be apparent in the report, but may be difficult to deduce from the output of MTR. For this reason it is often best to collect MTR reports in both directions when you’re experiencing an issue.
Latency
Aswell as packet loss an MTR can help identify latency issues between your machine and the target host. It is normal to see latency increase at each hop however latency should be linear, it can often be helpful when looking at latency issues to resolve DNS entries as geographical assumptions can then be made regarding increases in latency.
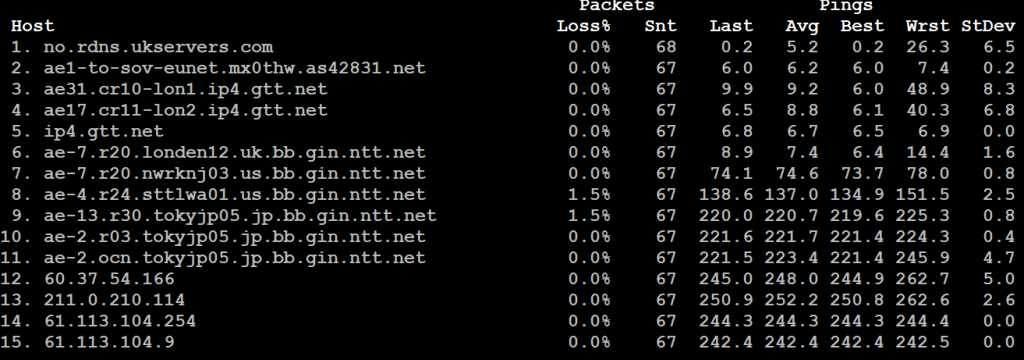
A typical MTR may look as follows:

The MTR above shows:
- Increases in latency between hops 6 and 7
- Increases in average latency etween hops 9 and 10
- The MTR also shows packet loss at both the routers at hops 8 and 9. As there is no packet loss to the final destination the cause of this can be determinated as ICMP rate limiting traffic targetted directly at the managment interfaces of these routers and as there is no packet loss to the final destination this is not of concern.
The increases in latency at both hops 6/7 and 8/9 appear to co-incide with long distance routing. You can see from the RDNS/PTR records for hops 1-6 that the traffic looks to be transiting routers within London and latency therefore stays low around 7ms. At hop 7 the RDNS changes to “ae-7.r20.nwrknj03.us” appearing to indicate that traffic host crossed the Atlantic at this point and latency of 66ms is to be expected for traffic travelling over fibre (e.g speed of light) across such a distance. The same is seen at hop 8/9 where traffic appears to leave “sttl” or Seattle and travel across the pacific to Tokyo with an increase in latency of around 90ms. If such an increase in latency was seen across a small distance e.g From Coventry to London then this would likely indicate an issue however increases as this are expected across such long physical distances.
What are ??? in my MTR’s?
From time to time you may see the following within your MTR’s at various hops.
????
This is unlikely to indicate an issue in itself and is normally caused by:
– Routers completely dropping ICMP packets targetted at the router, either for security reasons or to limit ICMP traffic targetted at the router
– An issue with the return route, therefore displaying the hop as a timeout.
Contacting network operators when you locate an issue
If you are experiencing issues with your connection and have located an issue with an unexpected increase in latency or packet loss it is normally wise to contact your network provider you can alternatively also contact the network at which you belive the issue is occuring. The website https://bgp.he.net/ is a useful resource for running IP lookups and providing details on the network provider where the issue is occuring. Most network operators welcome MTRs when customers report faults preferably in both directions and with the source and destination IP’s clearly shown and you will often find this should speed up the resolution of any problems.


